18 Important functions in Pandas
Data processing is an important part of analyzing data. This includes various tasks like cleaning, restructuring, merging, removing duplicates, removing Null or NaN values etc. Pandas provides large set of functions to proceed with various data pre-processing tasks.
Pandas provides two type of data structures to work with data which includes Series and DataFrame.
I am learning and exploring Pandas and other Python libraries from last 2 years.
Any task that you can do in excel can be done using Pandas.
In this story I have curated a list of 18 most frequently used functions which I have used during data preprocessing tasks.
1) DataFrame.select_dtypes( ):
Returns a subset of the DataFrame’s columns based on the column dtypes.
Useful in cases when you want to select only those columns with specific datatype or values with specific datatype for example — “object”, “int64” , np.number etc.
Syntax :
DataFrame.select_dtypes(include = “reqd dtype”, exclude = “reqd dtype”)
Example :
#create DataFrame-----------------
df = pd.DataFrame({'points': [25, 12, 15, 14, 19],
                   'Player': ["A","B" , "C", "D", "E"],
                   'rebounds': [11, 8, 10, 6, 6]})#checks column datatype--------------------
df.info()#selecting reqd datatype----------------------
df.select_dtypes(include = "int64")
Output :

2) DataFrame.drop_duplicates( ) :
Removes duplicate rows from dataframe, commonly used for data cleaning tasks. Keeping duplicate values in our dataset affects the further insights generated so data cleaning is important to avoid miscalculation.
Syntax :
DataFrame.drop_duplicates(subset=None, keep='first', inplace=False, ignore_index=False)Parameters:
- subset : Only considers certain columns for identifying duplicates, by default uses all of the columns.
- keep : can be considered {‘first’, ‘last’, False} , by default considers False.
This parameter is used to decide which duplicates should be considered. If you want to keep the first occuring value then keep = ‘first’ else ‘last’ and by default False for keeping all the duplicates. - inplace : It decides whether to process the changes in the dataframe or to return a copy.
inplace = Truemeans do the changes in the current dataframe andinplace = Falsemeans return a copy and leave the current dataframe as it is.By default false. - ignore_index : If True, the resulting axis will be labeled 0, 1, …, n — 1. By default
ignore_index = False.
Example :
#create DataFrame----------------------------
df = pd.DataFrame({'points': [25, 12, 15, 14, 19,25,12,14],
                   'Player': ["A","B" , "C", "D", "E","A","B","D"],
                   'rebounds': [11, 8, 10, 6, 6,11,8,6]})#drop duplicates-----------------------------------
df = df.drop_duplicates(subset = ["Player"],
                        keep ="first",
                        ignore_index = False)df
Output:

3) DataFrame.str.lower( ) :
Convert strings in the Series/Index to lowercase. Similarly, for uppercase we can use DataFrame.str.upper().
Syntax :
Series.str.lower()Example :
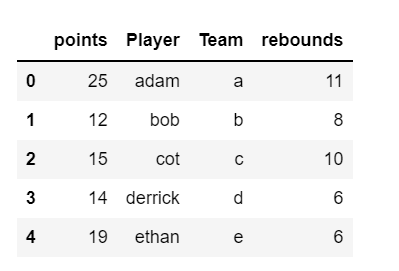
#create DataFrame--------------------------------df = pd.DataFrame({'points': [25, 12, 15, 14, 19],
            'Player': ["ADam","BOB" , "COT", "DerrICK","EtHan"],
             'Team' : ["a","B","C","d","e"],
            'rebounds': [11, 8, 10, 6, 6]})#converting column values of Player and Team into lowercase---------
columns = df.select_dtypes(include = 'object')
columns = list(columns.columns)
for i in columns:
    df[i] = df[i].str.lower()df
Output :
4) Series.str.match() :
Series.str.match() function is used to determine if data in a given series object matches a regular expression.
Syntax :
Series.str.match(pat, case=True, flags=0, na=None)Parameters :
- pat : Character sequence or regular expression.
- case : If True, case sensitive. By default True.
- flags : int, default 0.
- na : Fill value for missing values. The default depends on dtype of the array. For object dtype,
numpy.nanis used.
Example :
city = pd.Series(['Kolkata','Delhi','Mumbai', 'Sikkim','Bangalore'])
index = ["City_1","City_2","City_3","City_4","City_5"]
city.index = index
city
res = city.str.match(pat = '(Ranchi)|(Mumbai)')
res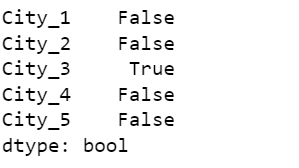
res = city.str.match(pat = '([A-Z]a.)')
res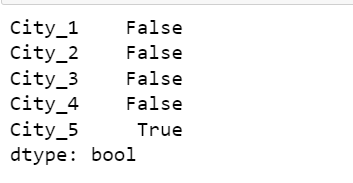
5) pd.set_option( ) :
Example :
data = {"Score" : [10, 15, 2, 31, 4,
                    51, 26, 17, 28, 29],
        "Player" : ['A', 'B', 'C', 'D', 'E',
                      'F', 'G', 'H', 'I', 'J']}
df = pd.DataFrame(data)
df
pd.set_option("display.max_rows", 5)
df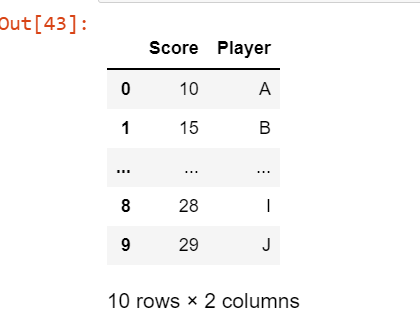
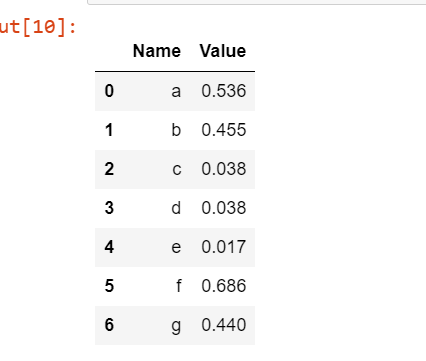
pd.set_option( ) can also be used to format high number decimal points/scientific notation to normal notation.
Example :
import numpy as np
import pandas as pddf = pd.DataFrame({
    'Name': ['a', 'b', 'c','d','e','f','g'],
    'Value': np.random.rand(7)**3
})
df
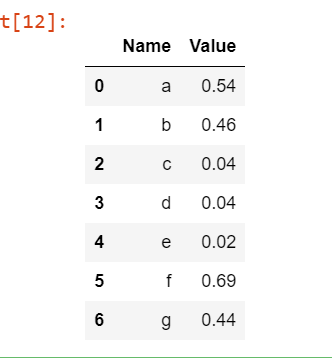
#formatting upto 2 decimal places
pd.set_option('display.float_format', lambda x: '%0.2f' % x)
df
Output :
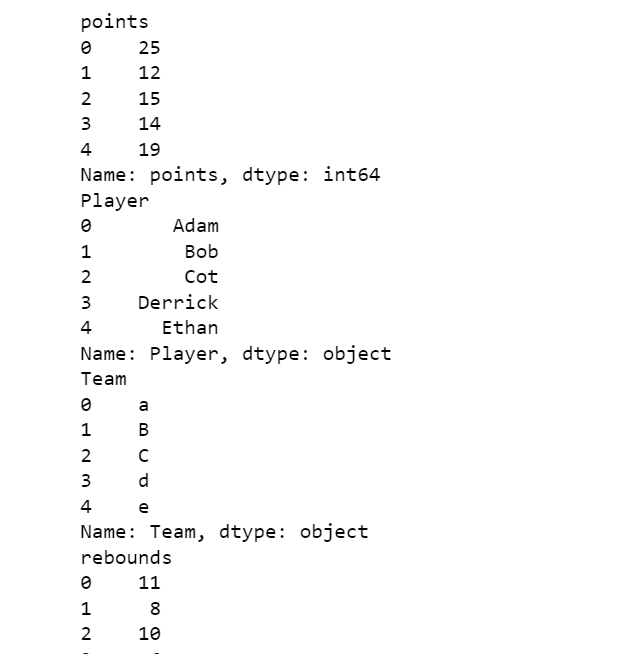
6) df.iteritems( ) :
Used to Iterate over (column name, Series) pairs. Iterates over the DataFrame columns, returning a tuple with the column name and the content as a Series.
The iteritems() method generates an iterator object of the DataFrame, allowing us to iterate each column of the DataFrame.
Example :
#create DataFrame
df = pd.DataFrame({'points': [25, 12, 15, 14, 19],
                   'Player': ["Adam","Bob","Cot","Derrick","Ethan"],
                   "Team" : ["a","B","C","d","e"],
                   'rebounds': [11, 8, 10, 6, 6]})
Iterate over columns :
for x, y in df.iteritems():
  print(x)
  print(y)
Output :
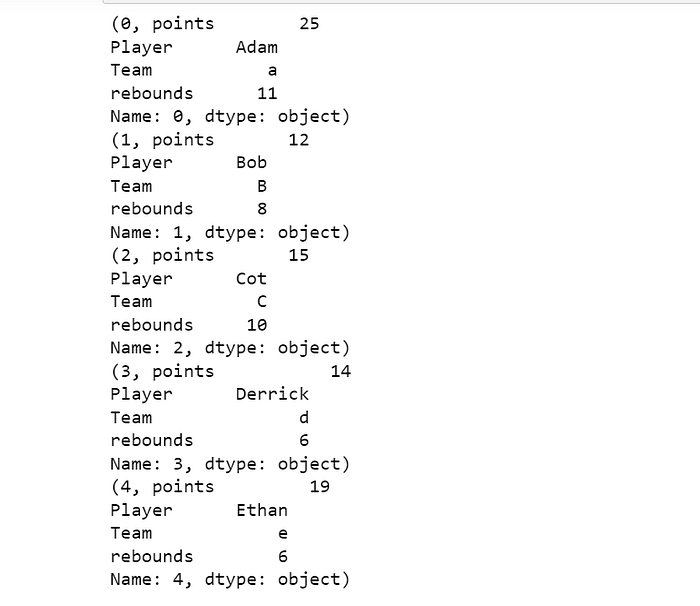
7) df.iterrows( ) :
Sometimes we need to iterate over a dataframe’s rows and columns without using loops, df.iterrows( ) is very helpful in such situations.
Iterate over DataFrame rows as (index, Series) pairs.
Example :
#create DataFrame
df = pd.DataFrame({'points': [25, 12, 15, 14, 19],
                   'Player': ["Adam","Bob","Cot","Derrick","Ethan"],
                   "Team" : ["a","B","C","d","e"],
                   'rebounds': [11, 8, 10, 6, 6]})#Iterating over DataFrame rows
for i in df.iterrows():
    print(i)
Output :
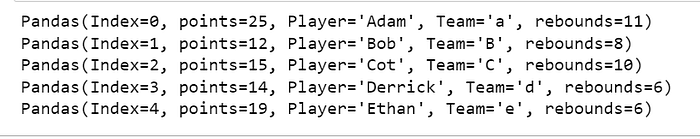
8) df.itertuples( ) :
Syntax :
DataFrame.itertuples(index=True, name='Pandas')Index = True and name = ‘Pandas’ by default.
Iterate over DataFrame rows as namedtuples of the values.
An object to iterate over namedtuples for each row in the DataFrame with the first field possibly being the index and following fields being the column values.
Example :
#create DataFrame
df = pd.DataFrame({'points': [25, 12, 15, 14, 19],
                   'Player': ["Adam","Bob","Cot","Derrick","Ethan"],
                   "Team" : ["a","B","C","d","e"],
                   'rebounds': [11, 8, 10, 6, 6]})for row in df.itertuples():
    print(row)
Output :
9) df.reset_index( ) :
Pandas reset_index() is used to reset index of a Data Frame.
reset_index() method sets a list of integer ranging from 0 to the length of data as index.
Example :
df = pd.read_csv('customer_data.csv')Setting column “Name” as index:
df.set_index(["Name"], inplace = True)
df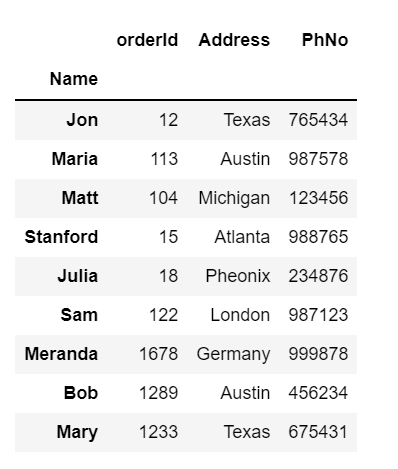
Resetting index :
df.reset_index()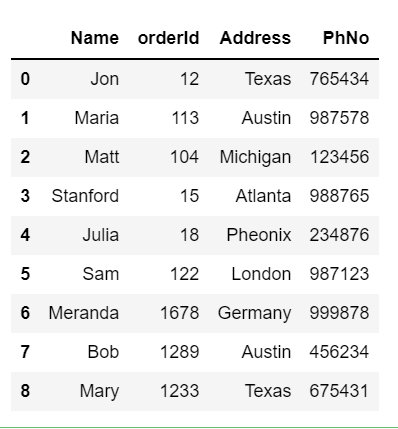
10) df.astype( ) :
DataFrame.astype() function is useful we want to cast a particular column data type to another data type.
Syntax :
DataFrame.astype(dtype, copy=True, errors='raise')Parameters :
- dtype : Use a
numpy.dtypeor Python type to cast entire pandas object to the same type. Alternatively, use{col: dtype, …}, where col is a column label and dtype is anumpy.dtypeor Python type to cast one or more of the DataFrame’s columns to column-specific types.
2. copy : By, default True. Returns a copy when copy=True (be very careful setting copy=False as changes to values then may propagate to other pandas objects).
3. Errors : By default ‘raise’. Control raising of exceptions on invalid data for provided dtype.
raise: allow exceptions to be raisedignore: suppress exceptions. On error return original object.
Example :
df = pd.read_csv("employees.csv")
df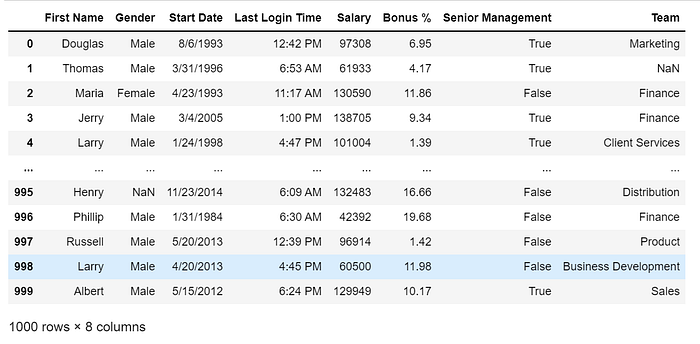
df.info()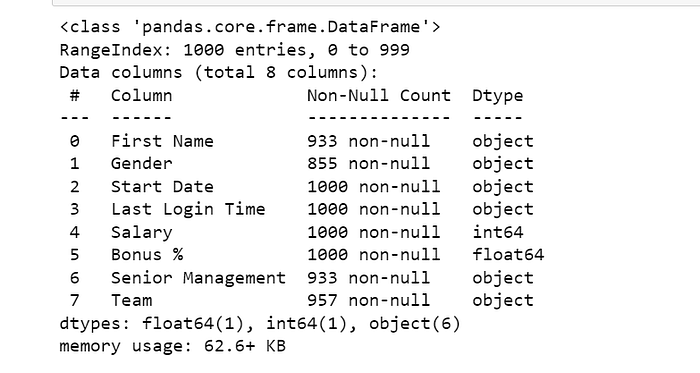
#changing the dtype of columns 'Team' and 'Salary'-----------
df = df.astype({"Team":'category', "Salary":'int64'})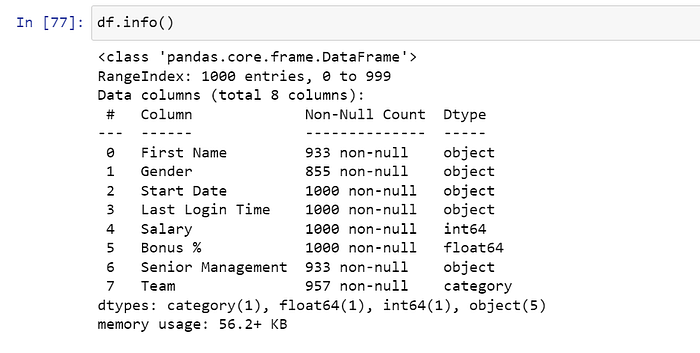
11) pd.concat( ) :
Concatenate pandas objects along a particular axis with optional set logic along the other axes.
Can also add a layer of hierarchical indexing on the concatenation axis, which may be useful if the labels are the same (or overlapping) on the passed axis number.
Syntax :
pandas.concat(objs, axis=0, join=’outer’, ignore_index=False, keys=None, levels=None, names=None, verify_integrity=False, sort=False, copy=True)Parameters :
- objs : a sequence or mapping of Series or DataFrame objects.
If a mapping is passed, the sorted keys will be used as the keys argument, unless it is passed, in which case the values will be selected. Any None objects will be dropped silently unless they are all None in which case a ValueError will be raised.
2. axis : default 0. The axis to concatenate along. Can be 0 for along the index and 1 for along the column.
3. join : {‘inner’, ‘outer’}, default ‘outer’.
4. ignore_index : bool, default False.
If True, do not use the index values along the concatenation axis. The resulting axis will be labeled 0, …, n — 1. This is useful if you are concatenating objects where the concatenation axis does not have meaningful indexing information. Note the index values on the other axes are still respected in the join.
5. keys : sequence, default None
If multiple levels passed, should contain tuples. Construct hierarchical index using the passed keys as the outermost level.
6. levels : list of sequences, default None
Specific levels (unique values) to use for constructing a MultiIndex. Otherwise they will be inferred from the keys.
7. names : list, default None. Names for the levels in the resulting hierarchical index.
8. verify_integrity : bool, default False
Check whether the new concatenated axis contains duplicates. This can be very expensive relative to the actual data concatenation.
9. sort : bool, default False
Sort non-concatenation axis if it is not already aligned when join is ‘outer’. This has no effect when join='inner', which already preserves the order of the non-concatenation axis.
Example :
import pandas as pd
df1 = pd.DataFrame({'points': [25, 12, 15, 14, 19],
'Player': ["Adam","Bob","Cot","Derrick","Ethan"],
'rebounds': [11, 8, 10, 6, 6]})
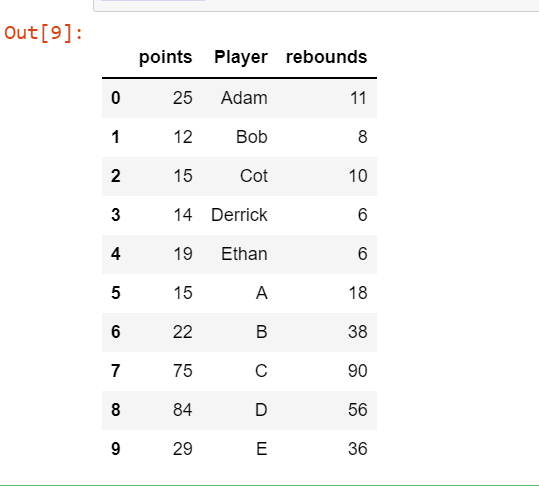
df2 = pd.DataFrame({'points': [15, 22, 75, 84, 29],
'Player': ["A","B" , "C", "D", "E"],
'rebounds': [18, 38, 90, 56, 36]})Concatenating df1 and df2:
# Concating both the dataframes
pd.concat([df1,df2])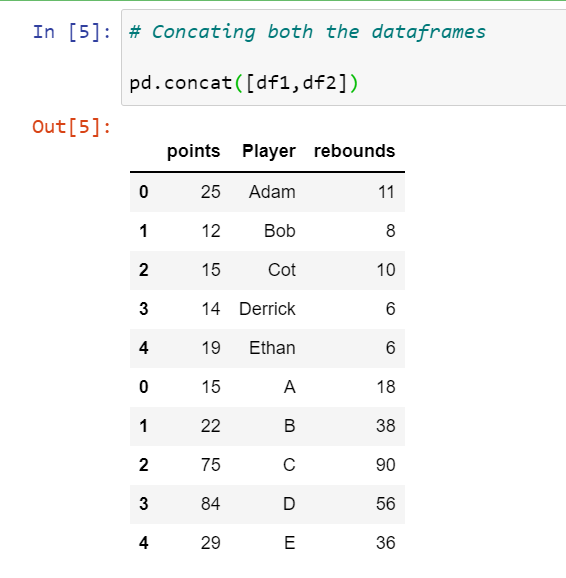
Assigning keys to the dataframes after concatenation :
df_concat = pd.concat([df1, df2], keys=['Set1', 'Set2'])
df_concat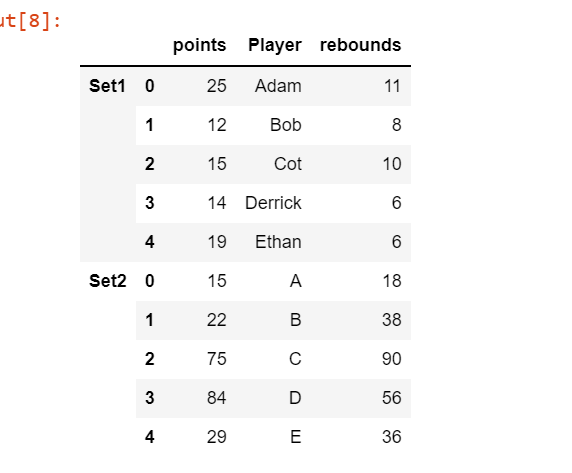
The index of both the sets is duplicated. So, usingignore_index = True :
df_concat = pd.concat([df1, df2],keys=['Set1','Set2'], ignore_index=True)df_concat
Adding the second DataFramedf2 along axis = 1:
df_concat = pd.concat([df1, df2], keys=['Set1', 'Set2'], axis=1)
df_concat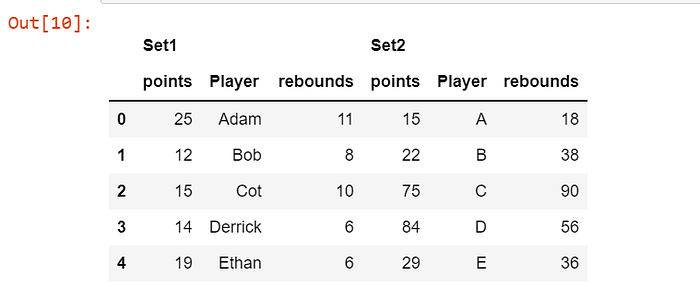
Combine DataFrame objects with overlapping columns and return only those that are shared by passing inner to the join keyword argument :
import pandas as pd
df1 = pd.DataFrame({'points': [25, 12, 15, 14, 19],
                   'Player': ["Adam","Bob","Cot","Derrick","Ethan"],
                   'rebounds': [11, 8, 10, 6, 6]})
df2 =  pd.DataFrame({'points': [15, 22, 75, 84, 29],
                   'Player': ["A","B" , "C", "D", "E"],
                   'rebounds': [18, 38, 90, 56, 36],
                    'Overs':[25, 12, 15, 14, 19]})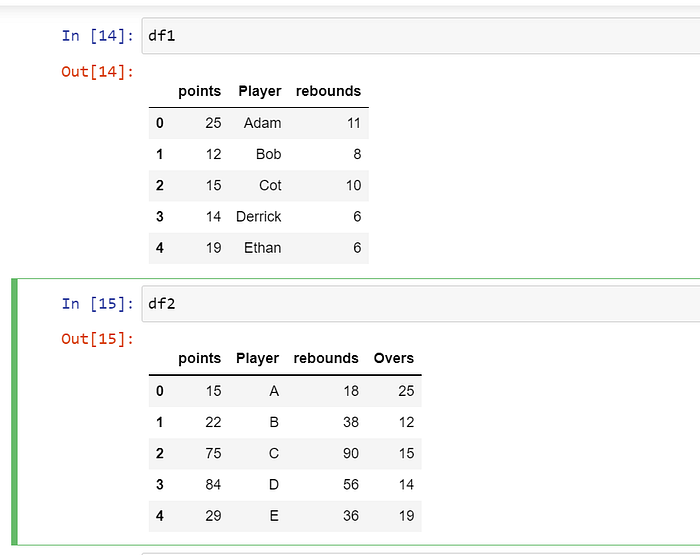
df_concat = pd.concat([df1, df2], join = 'inner')
df_concat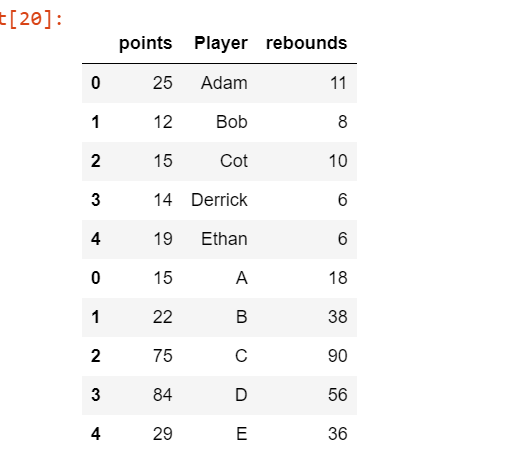
12) df.describe( ) :
describe() function is used to generate descriptive statistics including those that summarize the central tendency, dispersion and shape of a dataset’s distribution, excluding NaN values.
It analyzes both numeric and object series, as well as DataFrame column sets of mixed data types. The output varies depending on what data is provided.
Syntax:
DataFrame.describe(percentiles=None, include=None, exclude=None)Parameters:
1. percentile: list like data type of numbers between 0–1.
2. include: List of data types to be included while describing the dataframe.
3. exclude: List of data types to be excluded while describing the dataframe.
Example :
df2 =  pd.DataFrame({'points': [15, 22, 75, 84, 29],
                   'Player': ["A","B" , "C", "D", "E"],
                   'rebounds': [18, 38, 90, 56, 36],
                    'Overs':[25, 12, 15, 14, 19]})
df2.describe()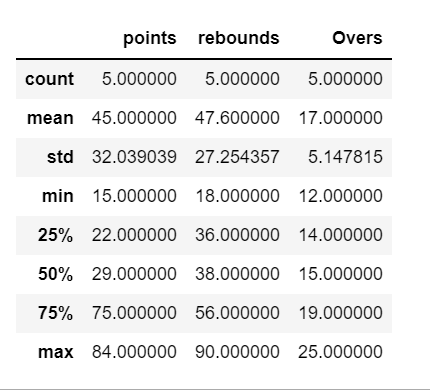
13) df.isnull( ).sum( ) :
Removing missing values, counting missing values and their percentage is important to identify before analyzing data.
df.isnull().sum() function is used to count the number of missing values in each column.
Data used : Walmart Sales Forecast | Kaggle
df = pd.read_csv('features.csv')
df.isnull().sum()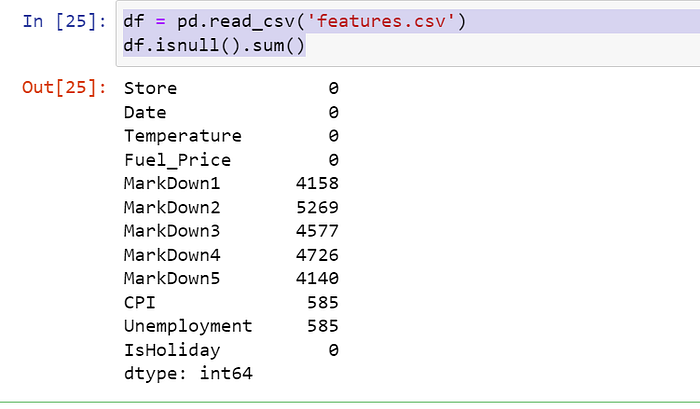
14) pd.isna( ) :
Detect missing values for an array-like object.
This function takes a scalar or array-like object and indicates whether values are missing (NaN in numeric arrays, None or NaN in object arrays, NaT in datetimelike).
For scalar input, returns a scalar boolean. For array input, returns an array of boolean indicating whether each corresponding element is missing.
df.isna()
Returns True where there is null value and False where there is not null value.
15) pd.to_datetime( ) :
Convert argument to datetime.
This function converts a scalar, array-like, Series or DataFrame/dict-like to a pandas datetime object.
s = pd.Series(['5/10/2022', '5/10/2022', '5/10/2022'] * 100)
s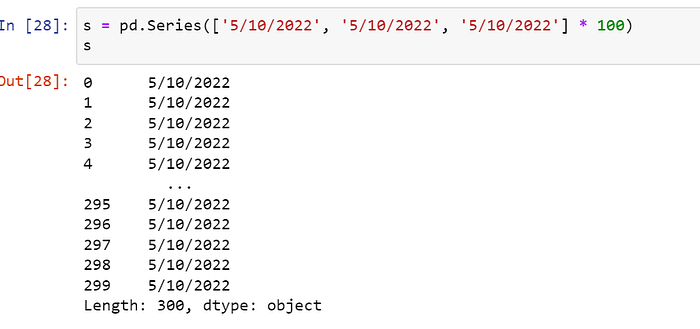
Changing the datatype of series s from object to datetime.
pd.to_datetime(s)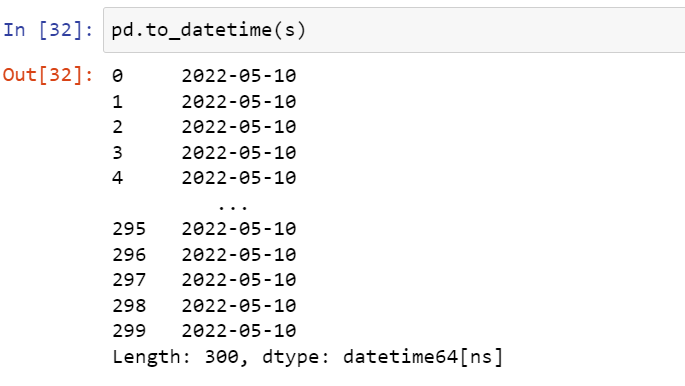
16) df.isin( ) :
isin() function can be passed a list to check if list of values is present in the dataframe/series.
Example :
s = pd.Series(['5/10/2022', '5/11/2022', '5/12/2022'] * 100)
lst = ['5/10/2022']
s.isin(lst)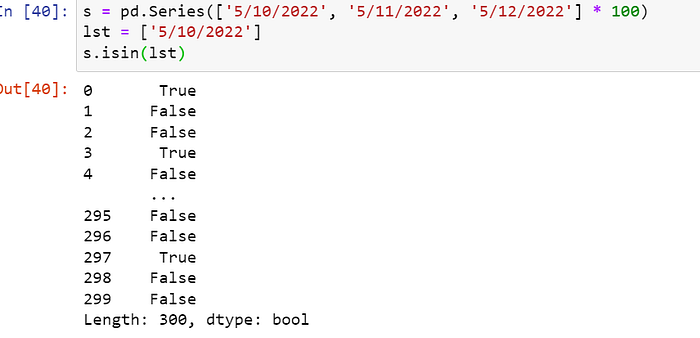
Returns True if value is present and False if value is not found.
17) df.pivot( ) :
Returns reshaped DataFrame organized by given index / column values.
Reshape data produces a “pivot” table based on column values. Uses unique values from specified index / columns to form axes of the resulting DataFrame. This function does not support data aggregation, multiple values will result in a MultiIndex in the columns.
Syntax :
DataFrame.pivot(index=None, columns=None, values=None)Example :
df2 =  pd.DataFrame({'points': [15, 22, 75, 84, 29],
                   'team': ["A","B" , "C", "D", "E"],
                    'player':['Adam','Tom','Jerry','Harry','Jon']})
df2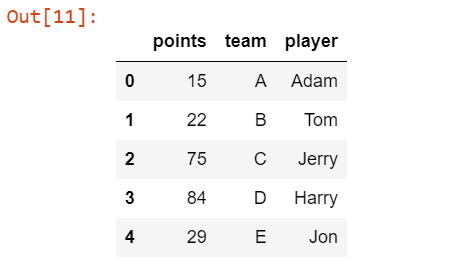
pivot_df2 = df2.pivot(index = 'player',columns = 'team',
                       values ['points'])
pivot_df2 = pivot_df2.fillna('-')
pivot_df2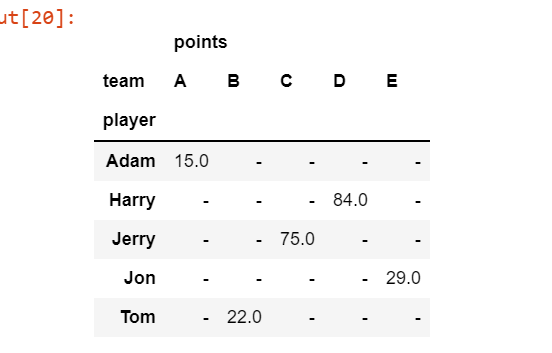
18) df.insert ( ) :
Inserts column into DataFrame at specified location.
Raises a ValueError if column is already contained in the DataFrame, unless allow_duplicates is set to True.
Parameters :
- loc : dtype is
int, Insertion index. Must verify 0 <= loc <= len(columns).
2. column: str, number, or hashable object. Label of the inserted column.
3. value : Scalar, Series, or array-like
4. allow_duplicates: bool, optional default False
Syntax :
DataFrame.insert(loc, column, value, allow_duplicates=False)Example :
df.insert(2,'age',[45,34,23,34,56,55,45,30,33])
df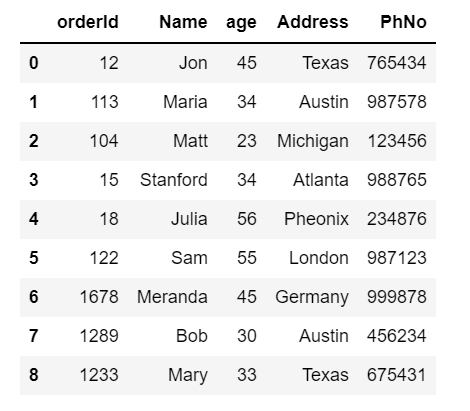
Always refer Pandas Documentation to get an in-depth understanding.
User Guide — pandas 1.4.2 documentation (pydata.org)
You can clap and let me know that this was helpful :)
Reminder : Add this story to your list so that you can go through it whenever you want.